Opioid Crisis
Exploring public's perception and implications of opioid painkillers abuse in the US
TIMELINE
October 2018 - February 2019
CATEGORY
data viz . digital methods . web
MY ROLE
Research and ideation, development of some research protocols and visualizations, illustrations
MAIN TOOLS
DM Tools, RawGraph, Exel, Gephy, Ai, Af, HTML5, CSS, jQuery
THE CONTEXT
This research was developed during the Final Synthesis Design Studio at Politecnico di Milano, a course held by members of Density Design Lab. The brief asked each group of students to select a public and social issue to observe and study, first through official data and afterwards through digital methods. As a group, we have chosen to focus on the Opioid Crisis that has affected the United States in recent years, finding it very controversial how something legal could contribute to such a vast sanitary emergency.
Legal opioids are medicines chemically very similar to heroin that act on opioid receptors in the spinal cord and brain to reduce the intensity of pain signals perception. Those medications can also produce plenty undesirable effects and can induce euphoria, particularly if taken at a higher-than-prescribed dose or administered improperly; if used for long-term treatments, they lead to dependence. Today in the US, the consumption and diffusion of opioid pain-relievers are alarmingly high; in 2017, deaths involving opioids have exceeded those caused by motor vehicle accidents.
FOLLOWING TRACES ONLINE 👣
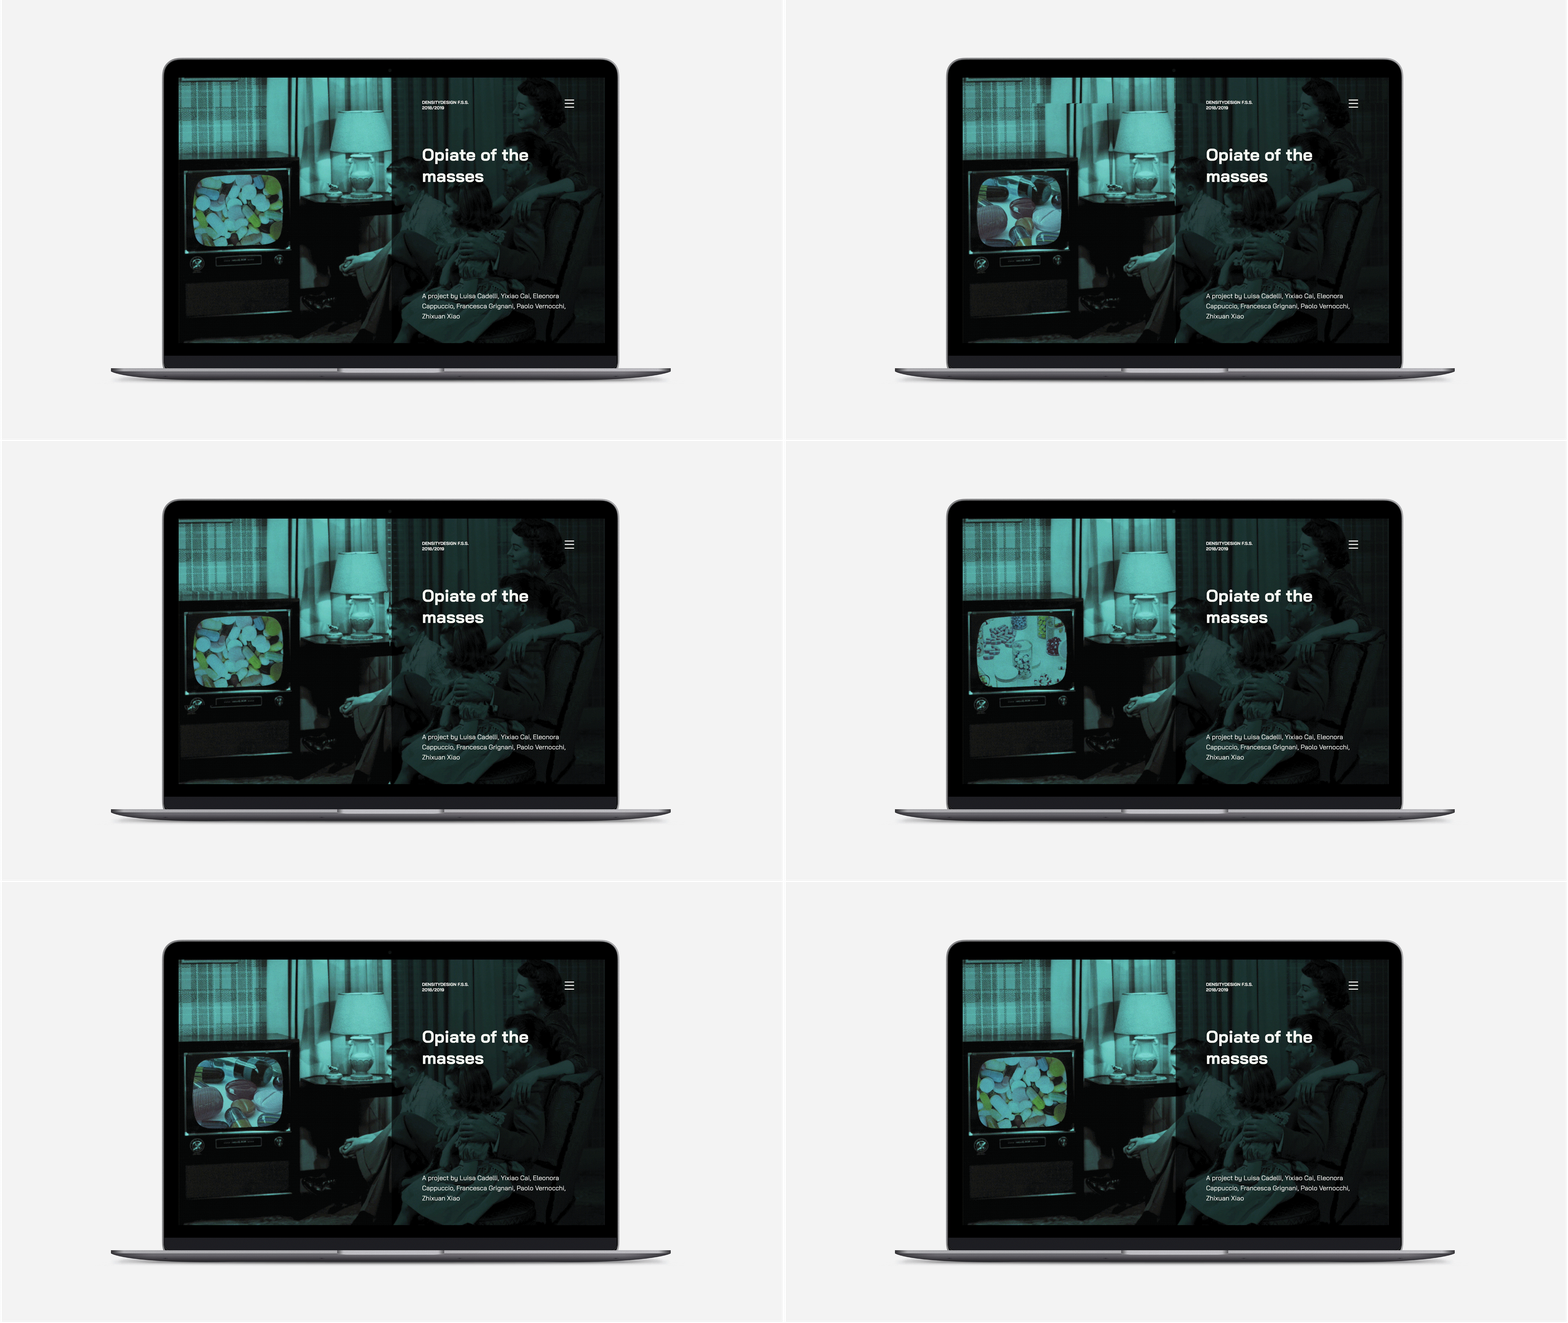
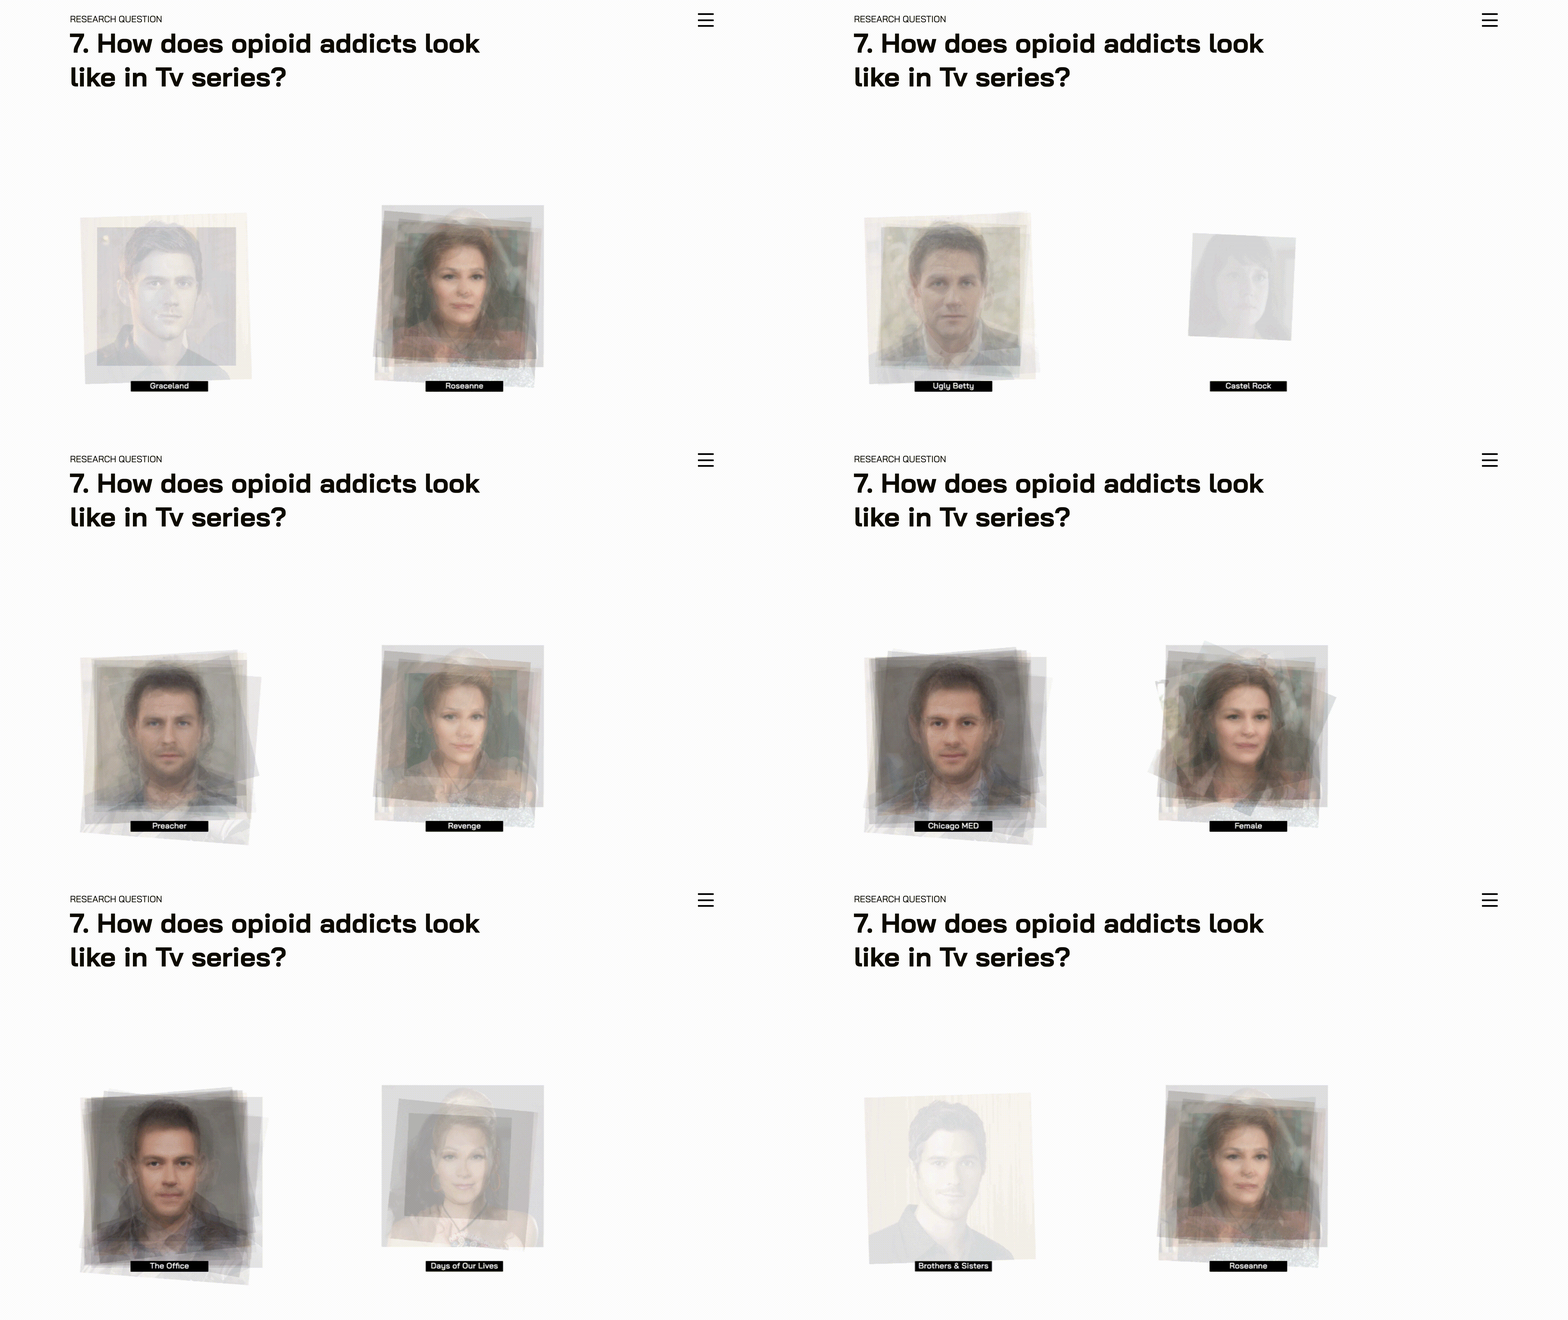
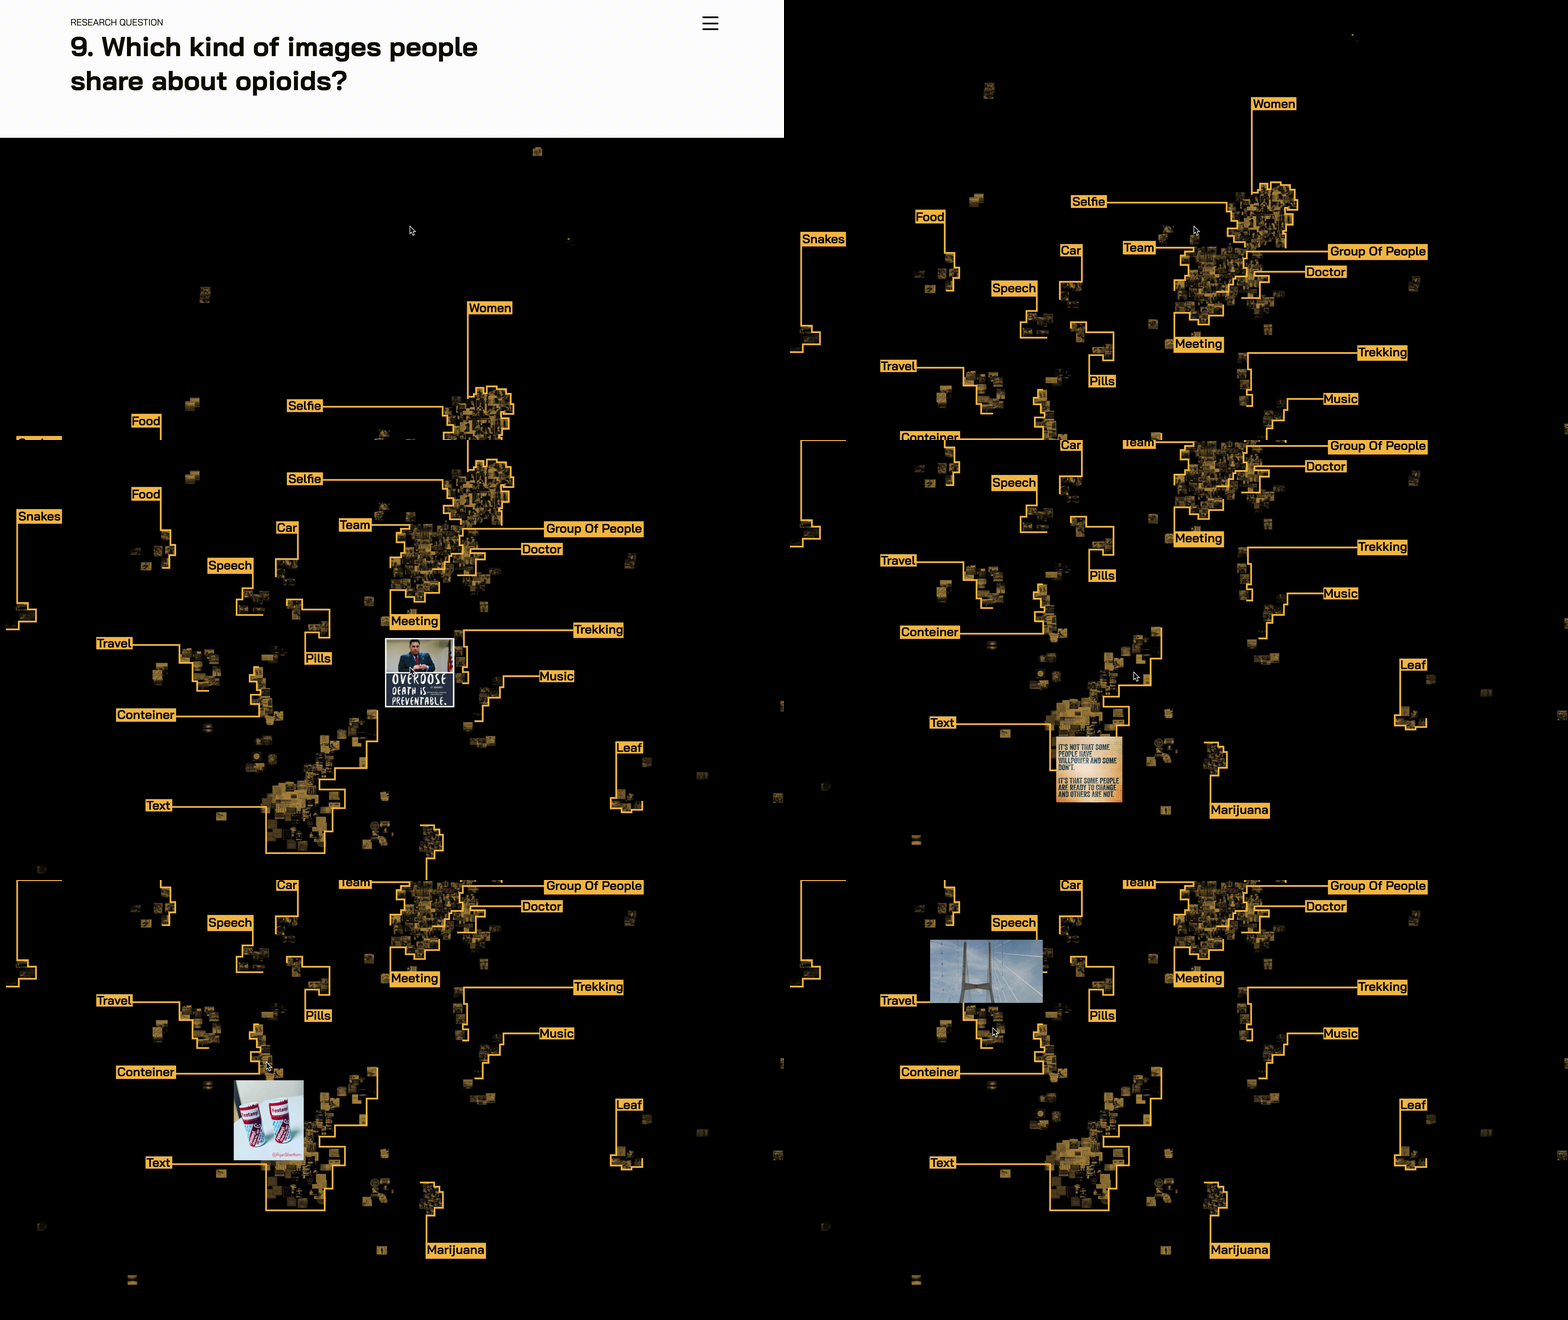
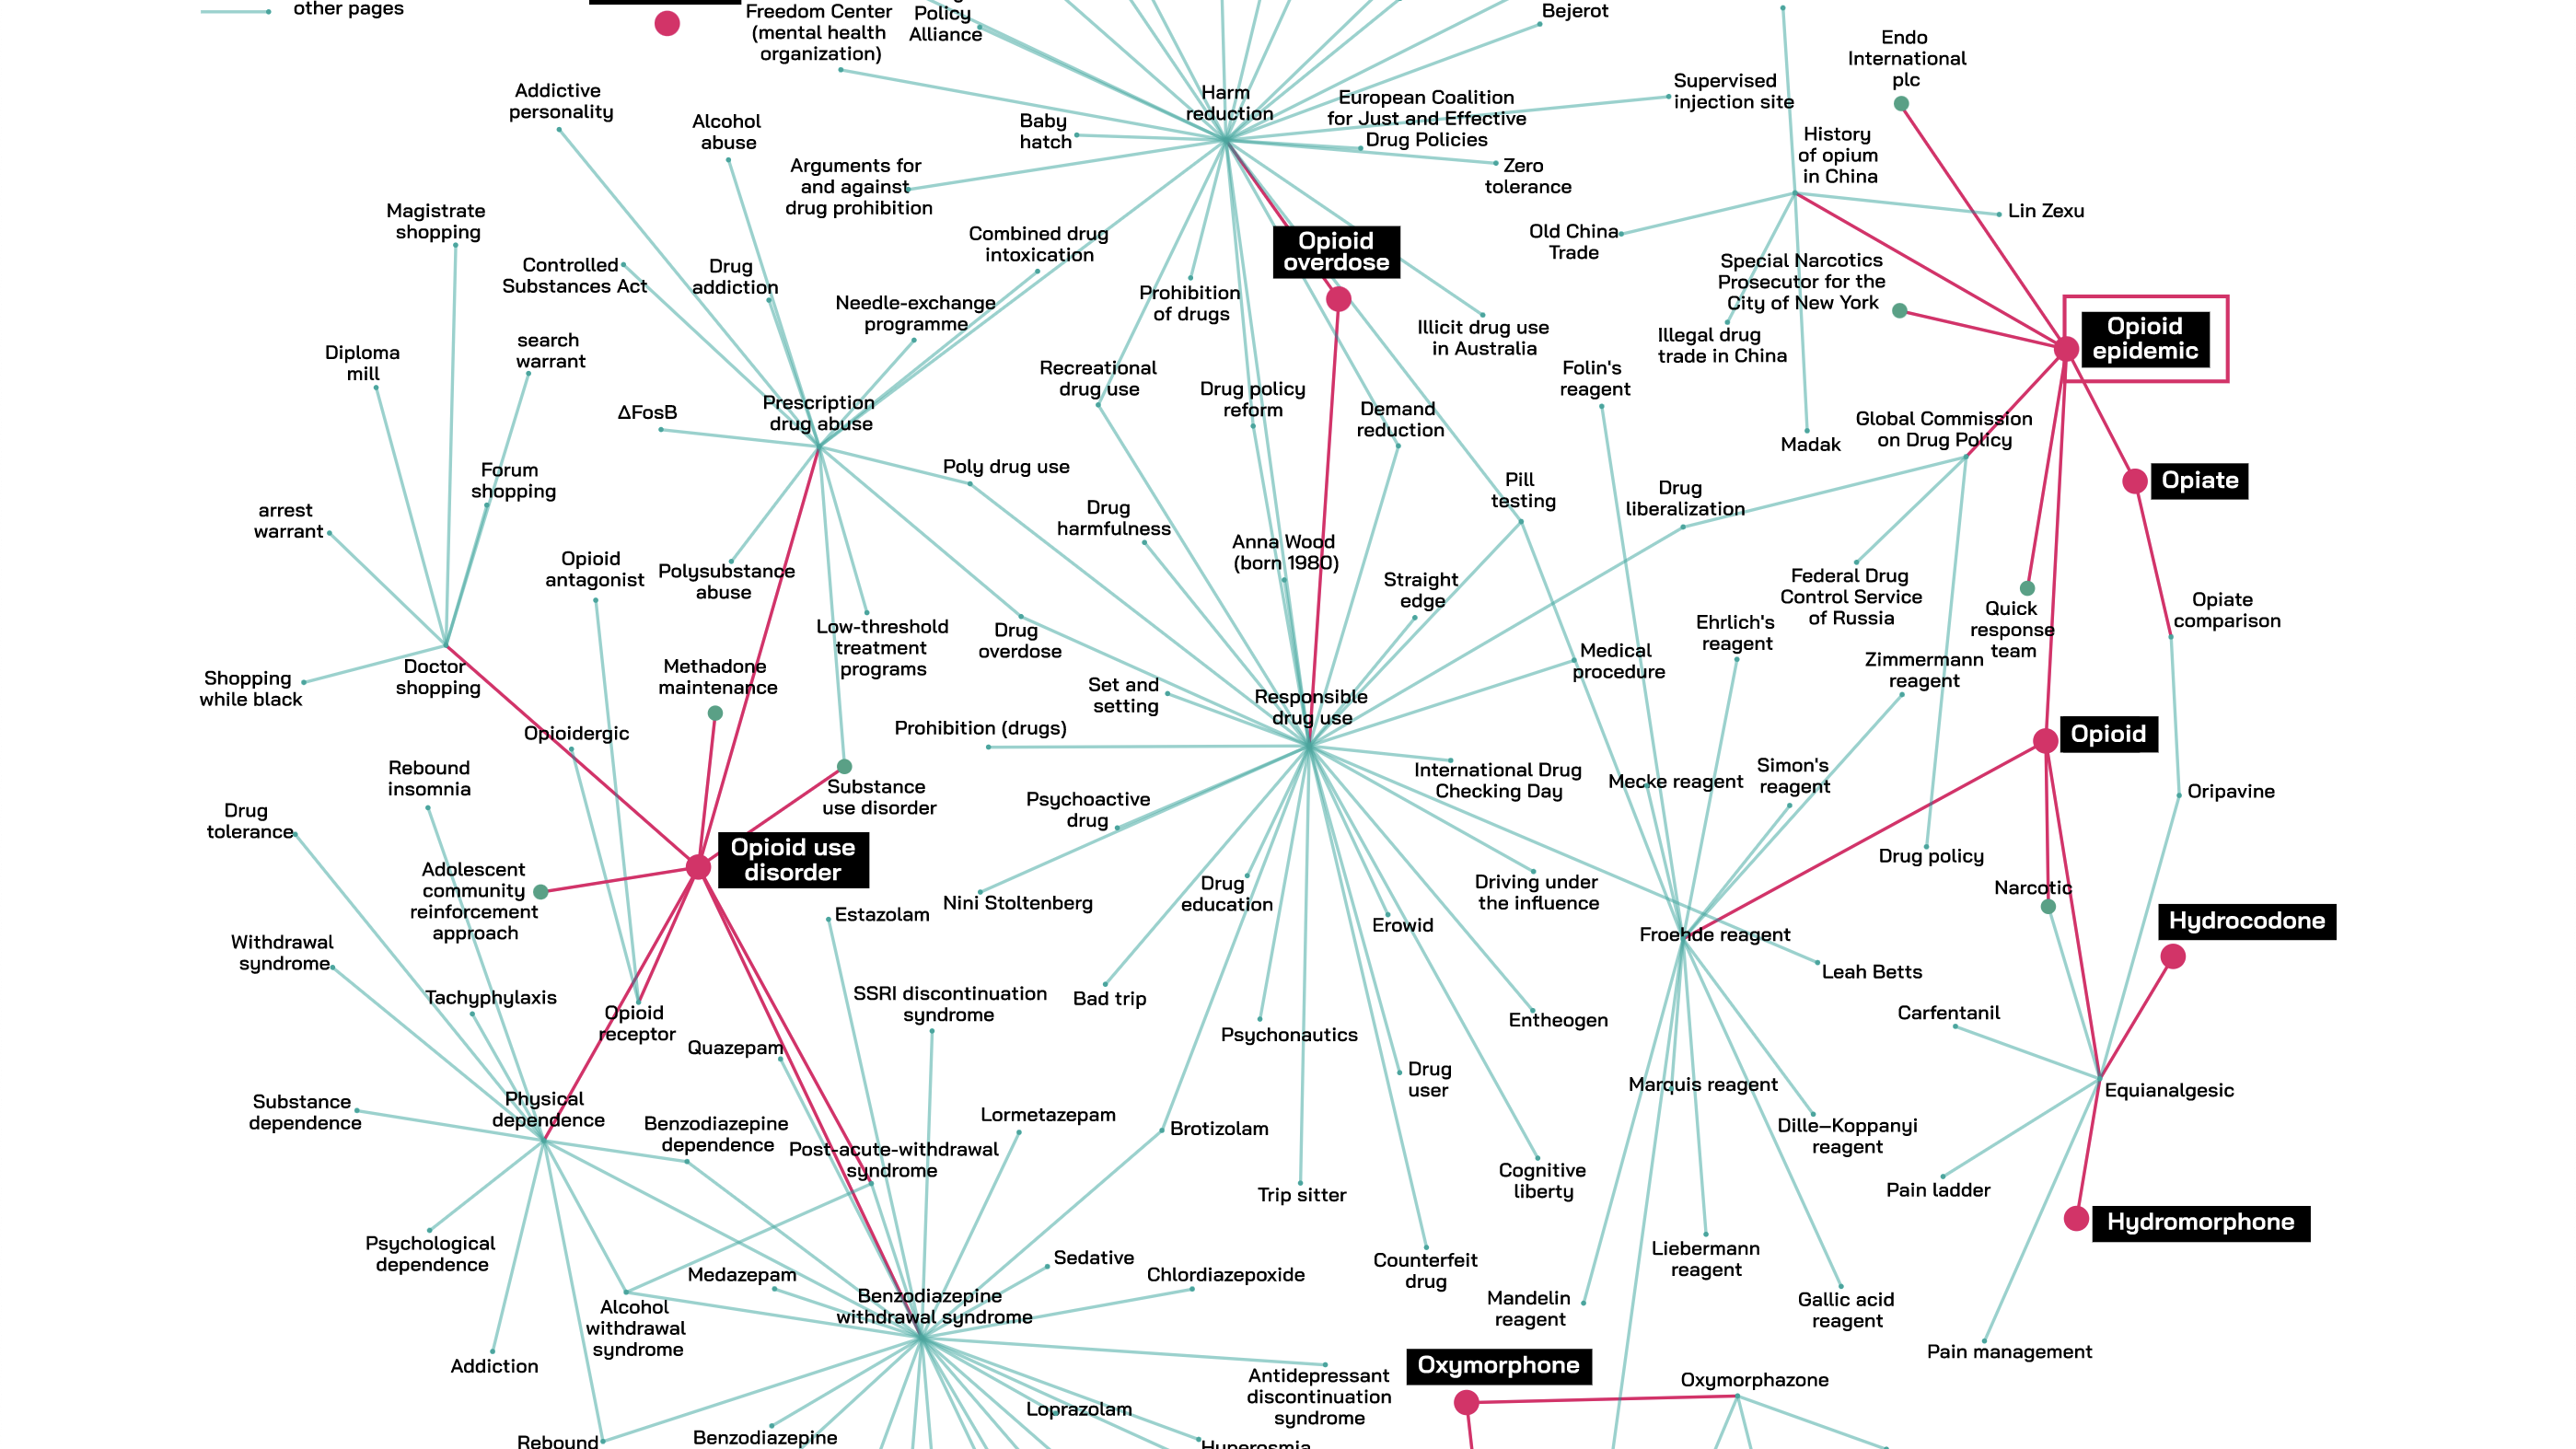
The online-based research, conducted following the approach proposed by digital methods, has been guided by a series of questions. What is possible for people to find on the internet about this topic? How are they reacting to it? What do they say, and what do they share? In an attempt to give some answers, we decided to focus our analysis mainly on those domains that have an image-based character. What can people see on Tv series, what do they share on Instagram or tell on Youtube? But also, what can they find on Google or Wikipedia? Do they get enough information to know the risks of taking prescription opioids? Is there a growing awareness? To address each question has been developed a specific protocol - a series of steps for data collection, elaboration and visualization -, often built upon the examples and tools shared by the Digital Methods Initiative. The results of such research are accessible on the website "Opiate of the masses".

VISUALIZING FOR ADVOCACY 📣
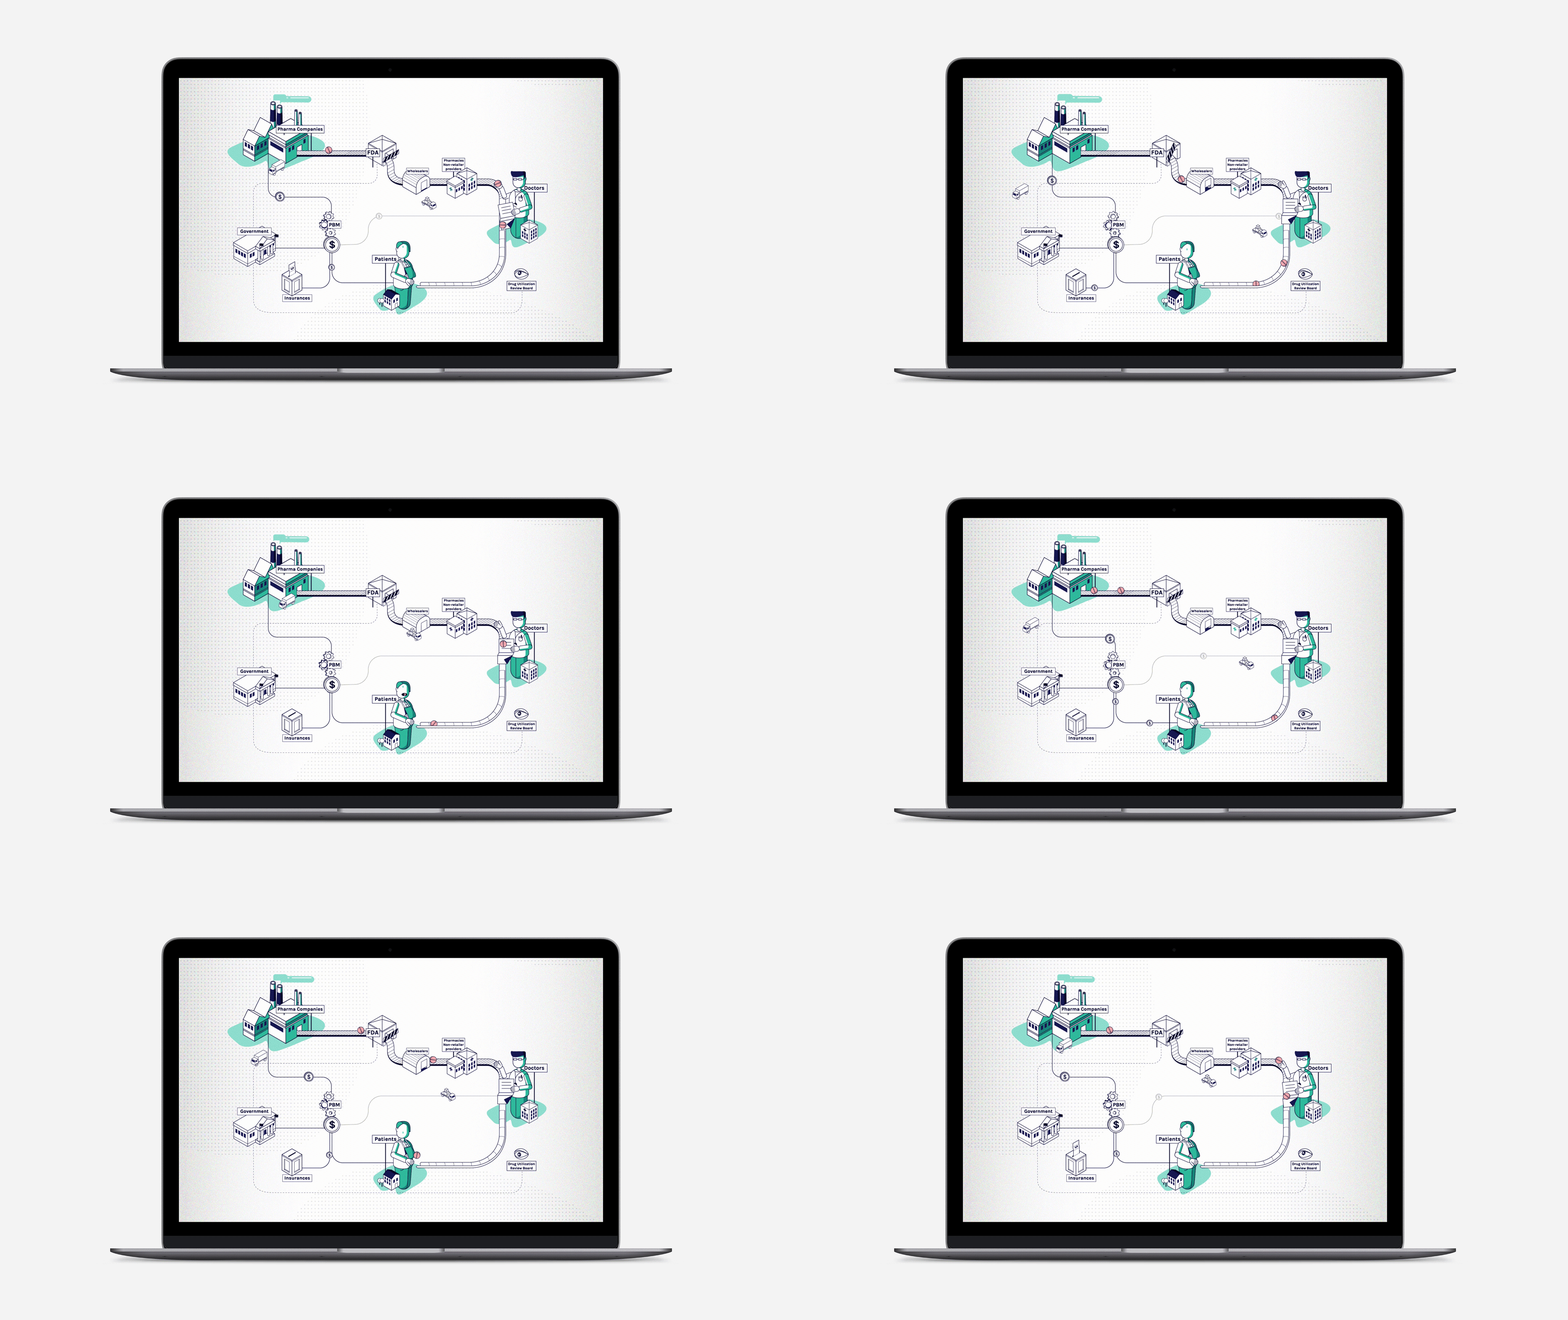
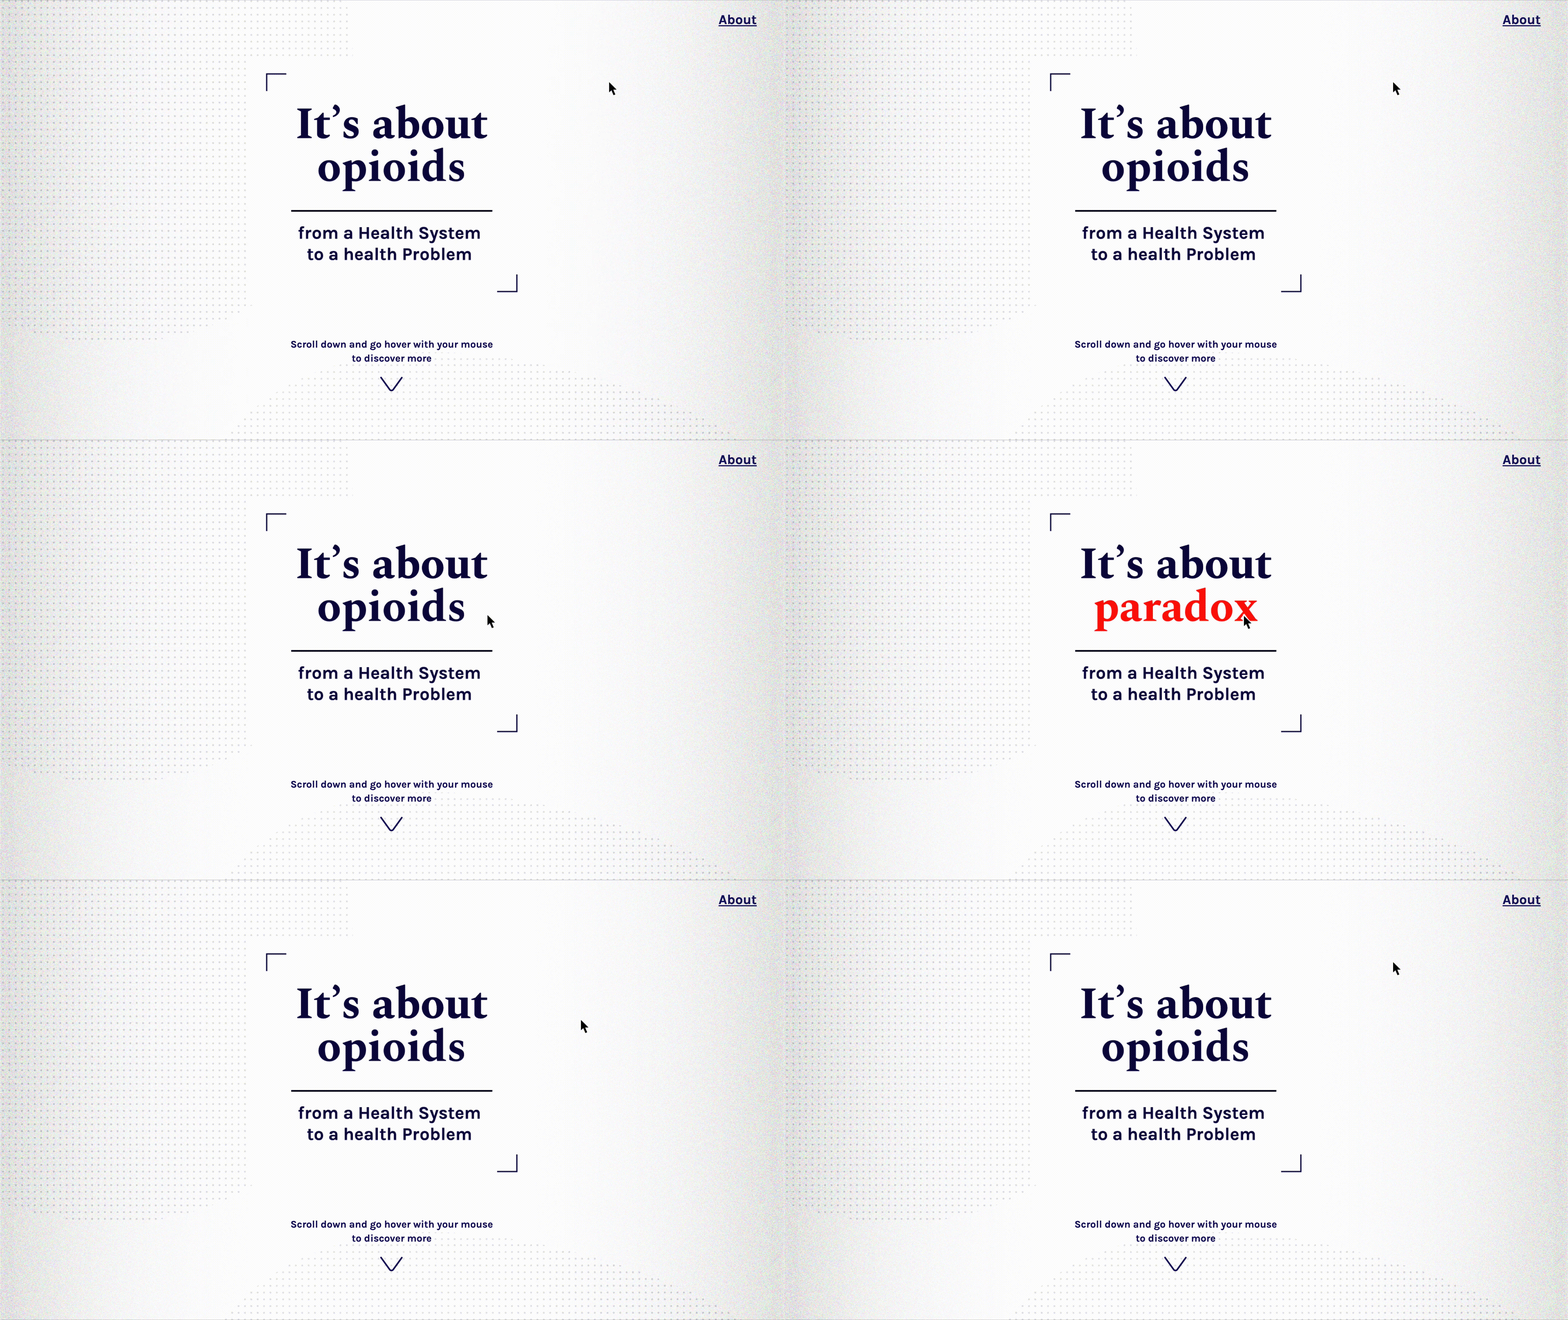
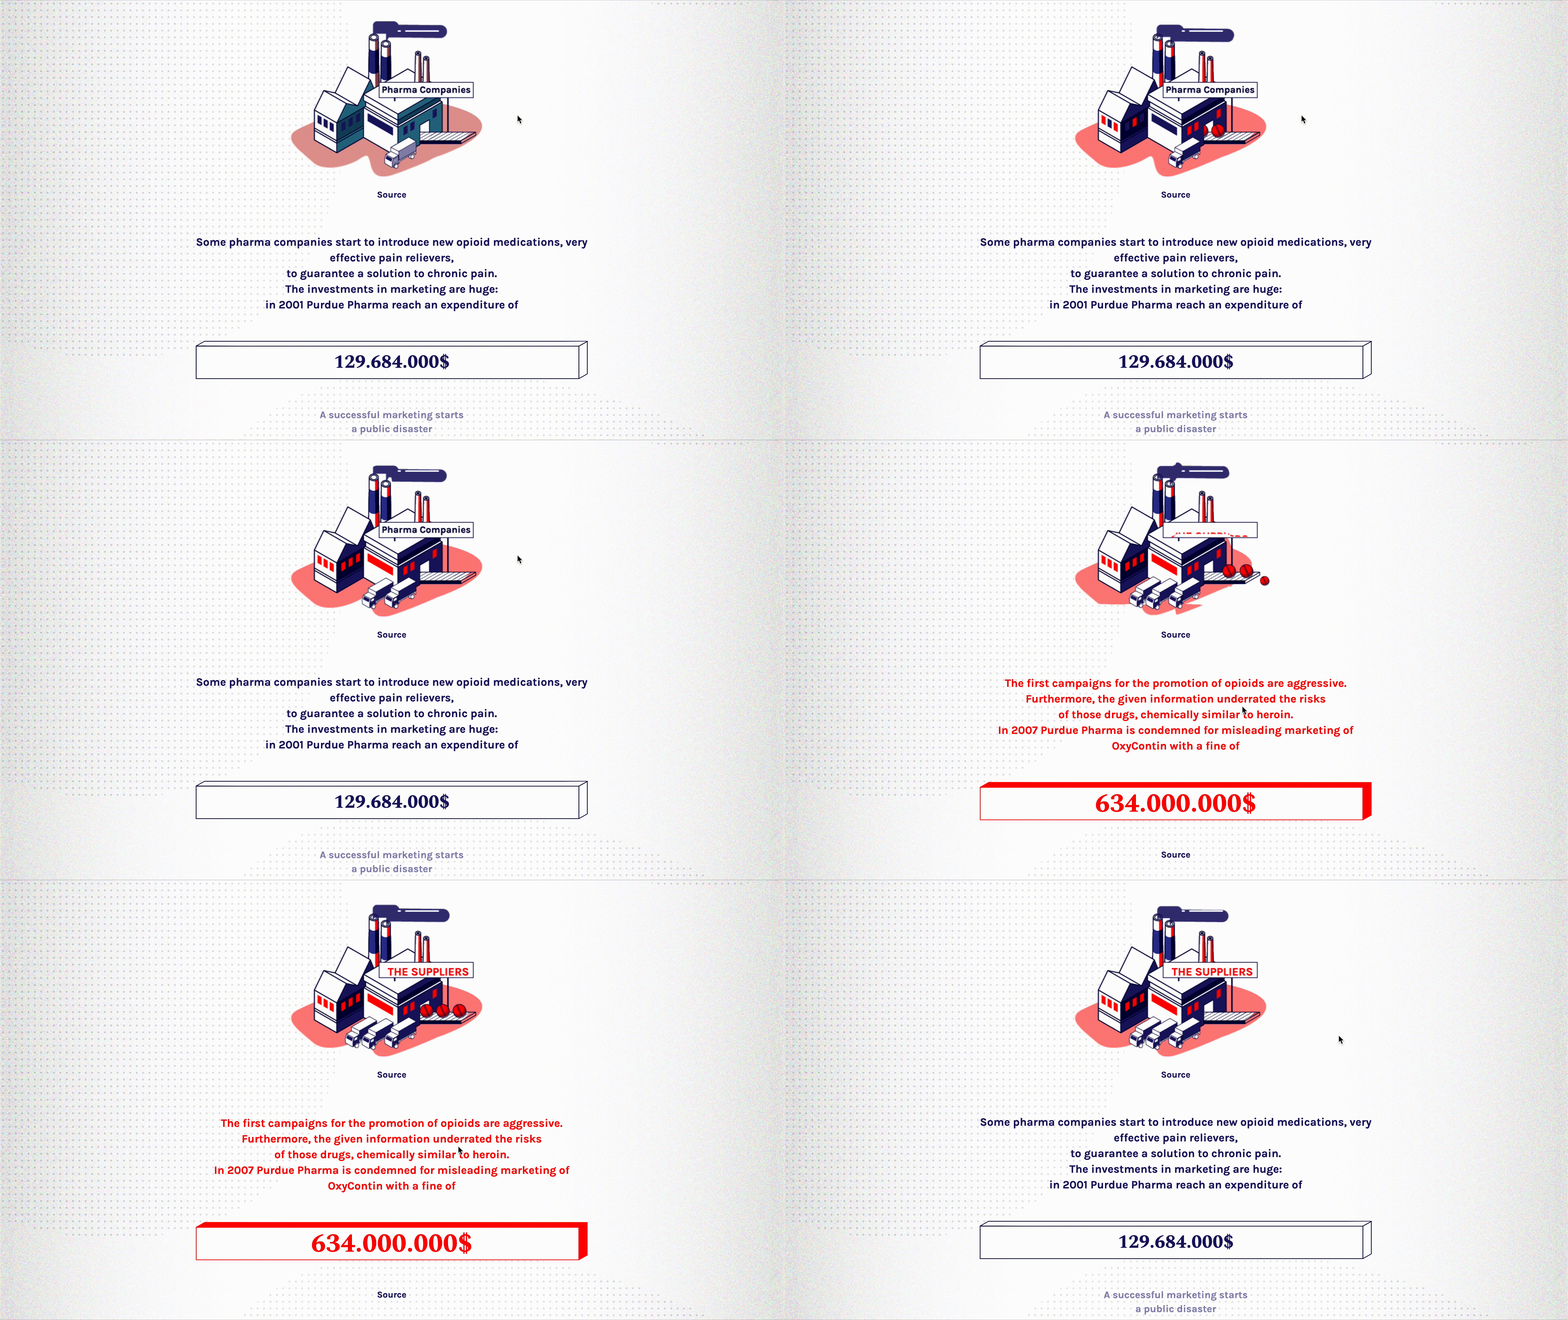
In the last phase of this project, we had to take a stand and repurpose our research to involve people, convey our point of view and enable dialogue on the issue. We decided to focus the attention on the paradoxical nature of this crisis, in which a system that is supposed to protect public health somehow turned into one that supports the diffusion and incorrect use of life-threatening drugs. We wanted to convey that it’s too easy to blame a single actor or pharmaceutical company for what is happening. If we're going to find one, the fault has to be searched in a series of choices and politics carried out, more or less knowingly, by all the parts of the system. The result is the website "It’s about opioids", in which the complex American sanitary system is represented as a circuit of related actors; for each of them is presented some politics and choices that contributed to the current situation, a broken system.
OUTCOME AND FINAL THOUGHTS
This research, together with other artefacts developed during the course, has been shared in a public exhibition at PoliMi, that had the attention of relevant actors in the sector. Even though the outcome is flawed by some inexperience, developing this project, it's been fundamental to approach the fields of data visualization and web design and, most importantly, discover a new methodology of work. Furthermore, addressing such a complex and multifaced issue with the proposed approach made me realize the value of data visualization as both an inquisitorial and communication device.